
Scientific tools
Advanced comparison, enrichment & signature analysis. A second layer of analysis on top of the core pipeline: rank-based GSEA, contrast-versus-contrast comparison, per-sample signature scores and your own gene sets.
Pricing on request · billed annually · works with Starter, Pro and Enterprise
Why it exists
A cut-off throws away most of your data
Over-representation analysis — included on every plan — asks which pathways are enriched among the genes that passed your significance threshold. It works, and it is the right first question. But it depends entirely on where you drew the line, and a coordinated shift of fifty genes that each moved a little is invisible to it.
The Scientific tools module adds the analyses that use the whole ranked list, that compare one contrast against another, and that score a signature in each sample rather than in the aggregate. It is the difference between reading a result and interrogating it.
Ranked GSEA, with the plot that justifies it
Every gene in the comparison is ranked, and each gene set is walked down that ranking to build a running-sum enrichment score. No threshold, no gene left out. The result carries a normalised enrichment score, a direction, and the leading-edge genes that drove it.
- Choose the ranking metric: log₂FC, signed p-value, or signal-to-noise
- Normalised enrichment score with FDR from 1 000 permutations
- Running-score enrichment plot for any gene set
- Leading-edge genes listed — the subset carrying the signal
- Runs against the same collections as ORA, plus your own gene sets
- Statistic
- Running-sum enrichment score (Subramanian et al., 2005)
- Ranking metric
- log₂ fold change · signed p-value · signal-to-noise
- Permutations
- 1 000
- Normalisation
- NES, against the permutation null
- Multiple testing
- Benjamini–Hochberg, computed separately for positive and negative NES
- Gene set size
- 15 – 500 genes
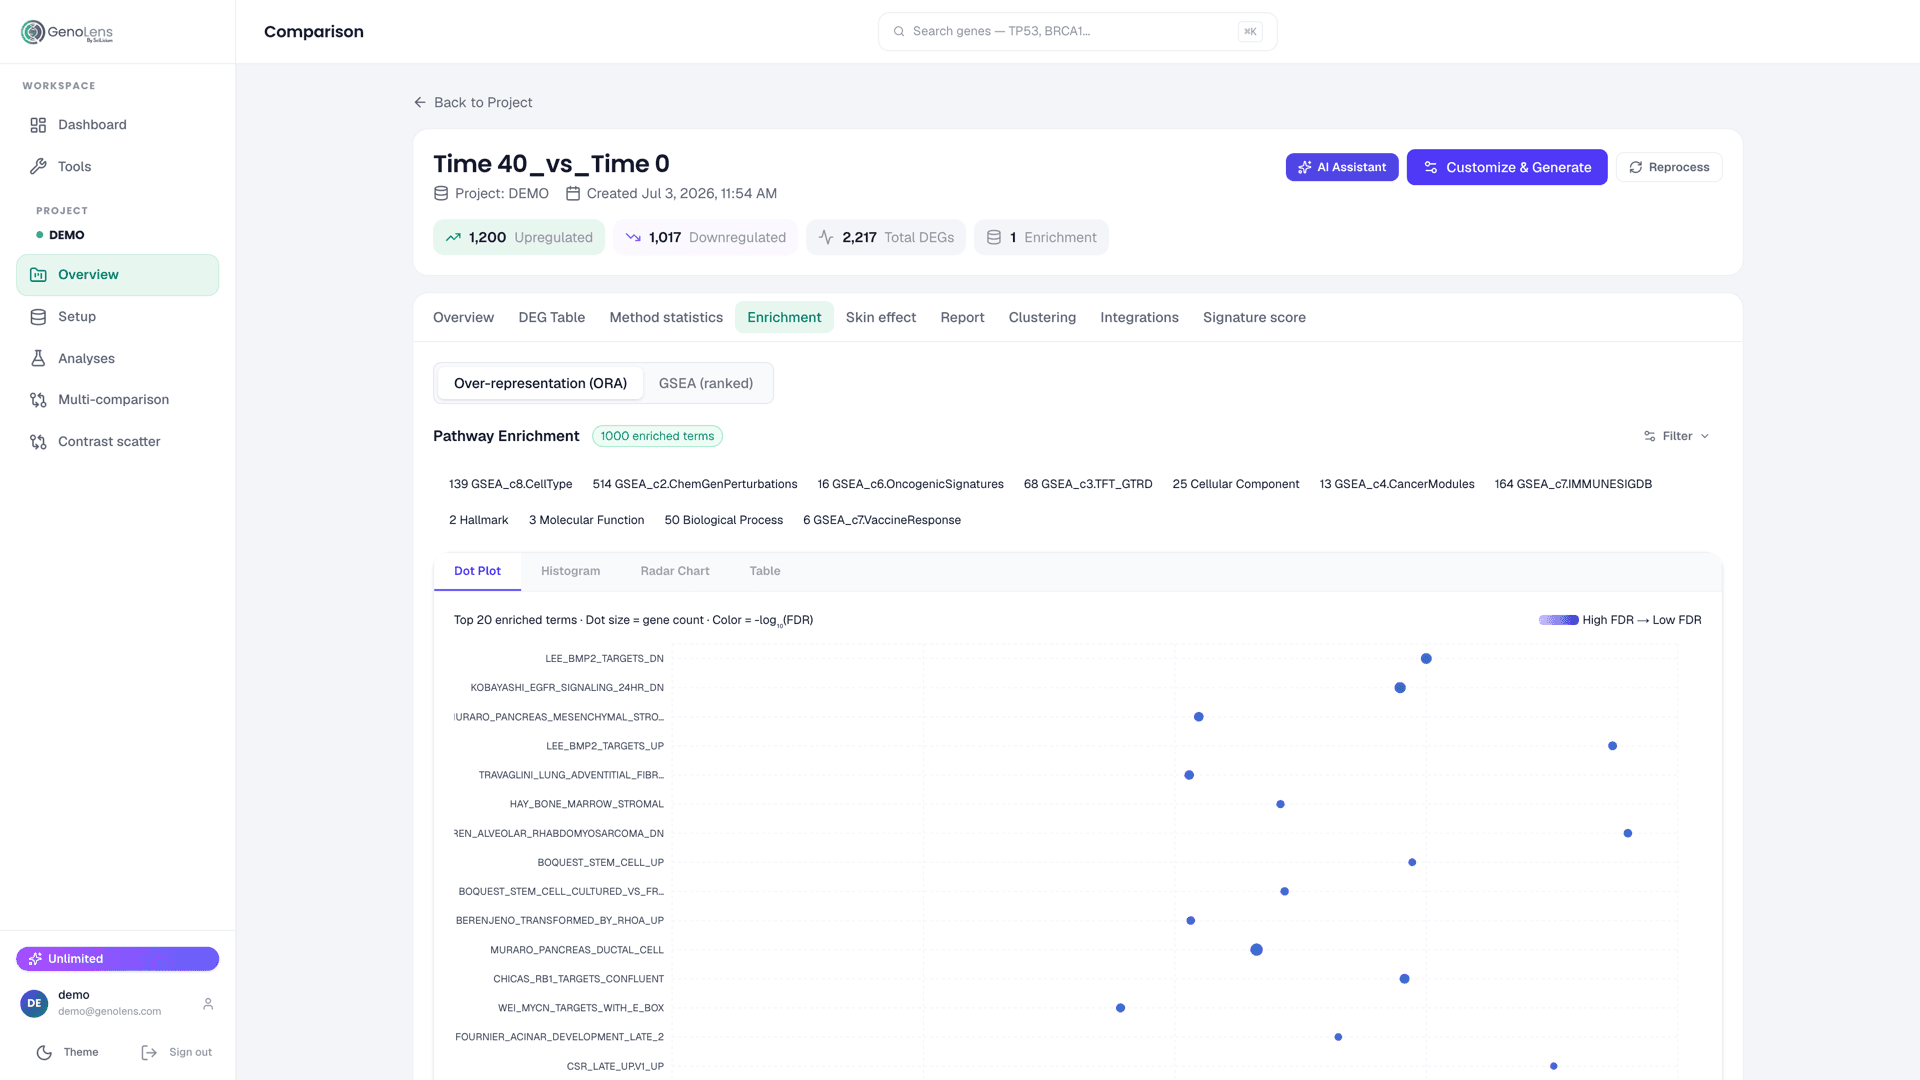
The GSEA tab sits next to the over-representation results on the same comparison, against the same gene set collections — Hallmark, GO, and the MSigDB C2–C8 collections.
Two contrasts, gene by gene
Plot the log₂ fold changes of one comparison against another. Each gene is classified against your own significance thresholds as concordant — moving the same way in both — discordant, or specific to a single contrast. It is the fastest way to ask whether two treatments, two time points or two cell lines are doing the same thing.
Concordant
Significant in both contrasts and moving in the same direction — the shared core of the response.
Discordant
Significant in both, opposite directions. Usually the most interesting quadrant, and the easiest to miss.
Specific
Significant in one contrast only — what makes this condition different from the other.
Thresholds are yours — padj and |log₂FC| are set per run. Defaults: padj < 0.05, |log₂FC| > 0.58.
Score a signature in every sample
A group-level fold change tells you the average moved. It does not tell you whether every sample moved, or whether two of them carried the whole effect. Signature scoring collapses a gene list into one number per sample — by default a mean z-score — so you can see the spread, compare conditions, and spot the outlier before it reaches a figure.
- Score a saved gene list, or paste genes directly
- Mean z-score scoring (recommended), computed across all samples
- Compare score distributions between conditions
- Reuse the same signature across comparisons and projects
Your own gene sets
Public collections rarely contain the set you actually care about — an in-house panel, a signature from a paper, a list a collaborator sent over. Bring it in and use it everywhere ORA and GSEA run.
- Paste a gene list, or upload a GMT file
- Saved per project and reusable across comparisons
- Available to both over-representation and ranked GSEA
DEG patterns
With more than two conditions, the question stops being “which genes changed” and becomes “which genes changed the same way”. DEG patterns group genes by their behaviour across every condition in the dataset — monotonic, transient, late-onset — rather than one contrast at a time.
- Patterns computed across all conditions, not pairwise
- Groups genes with a shared temporal or dose profile
- Each pattern exports as a gene list you can enrich
What it needs
A completed comparison. Signature scoring also needs the expression matrix.
Everything here runs on a comparison you have already analysed — there is nothing new to upload. See the core platform features for what happens before this point.
Other modules
Modules combine — each one adds to the same comparison
Talk to us
Add ranked GSEA to your account
The Scientific tools module attaches to any plan. Tell us which analyses you need and we will quote it.